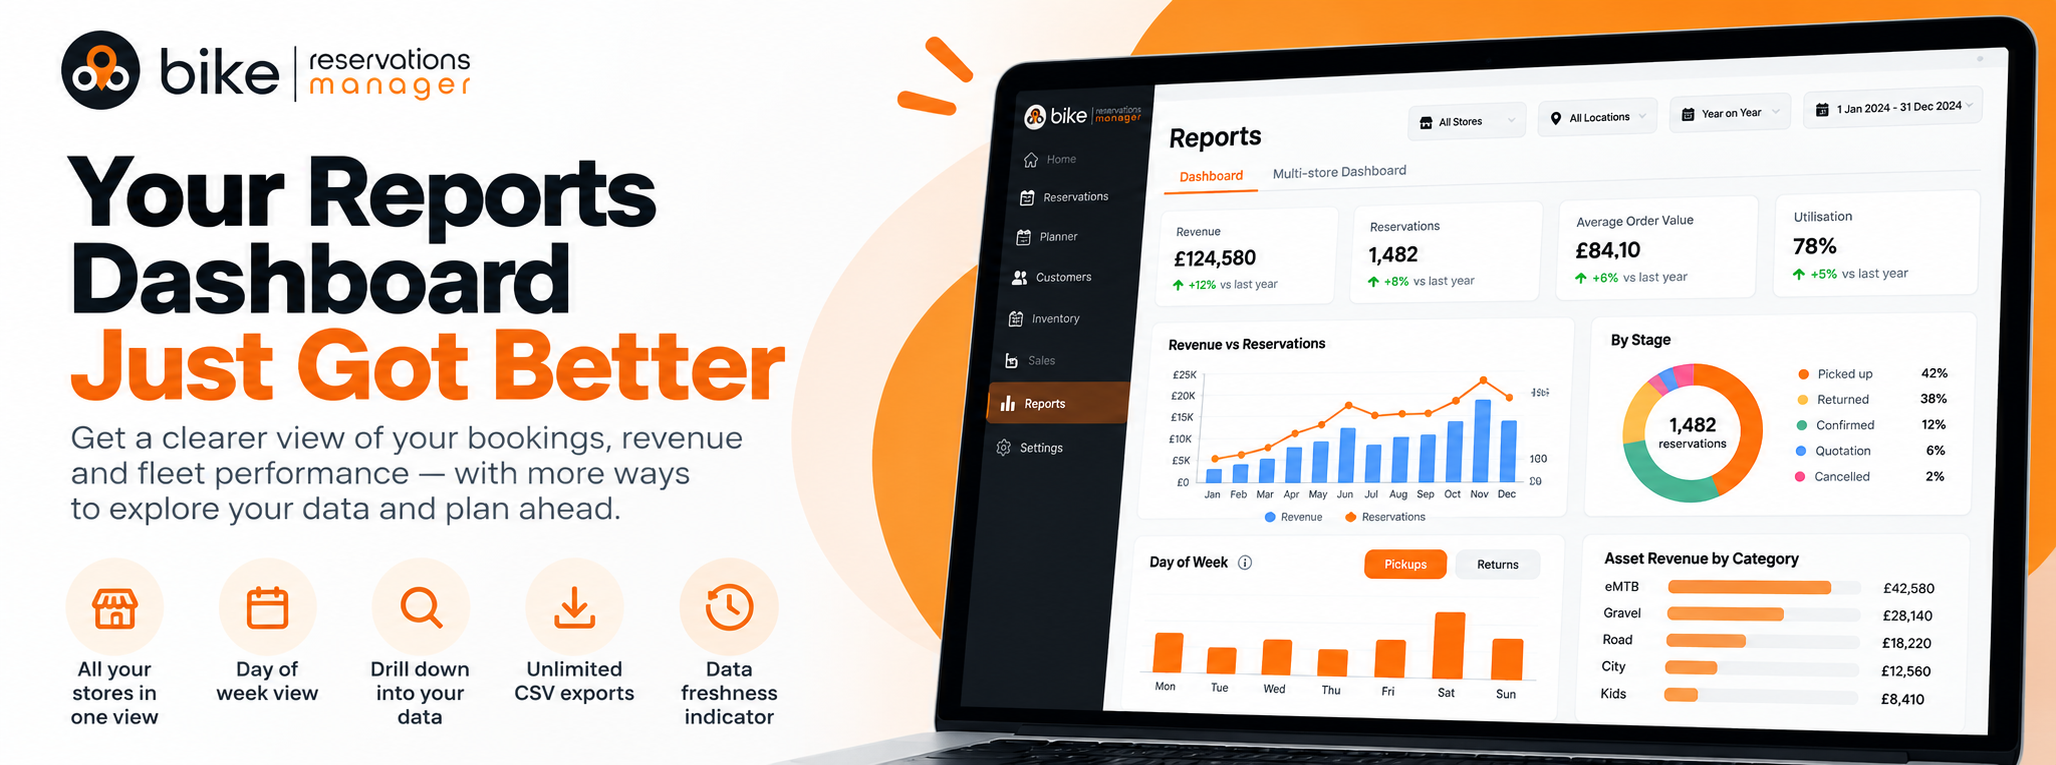
We’ve recently launched the new BRM Reports Dashboard giving you a clearer, more powerful way to understand your business performance, with all your stores, bookings, revenue and fleet data in one place.
Explore your data in more detail, compare performance across stores, identify your busiest days and drill down into the numbers that matter to you.
How do I see my store's reservation and revenue performance?
To see your store's reservation and revenue performance, open Reports and the Reports Dashboard. Filter by date, stage, channel or discount code, then use the charts to compare revenue and bookings, drill into individual asset categories, and export the full result set as CSV.
Location: Available via the Reports section in the BRM back office
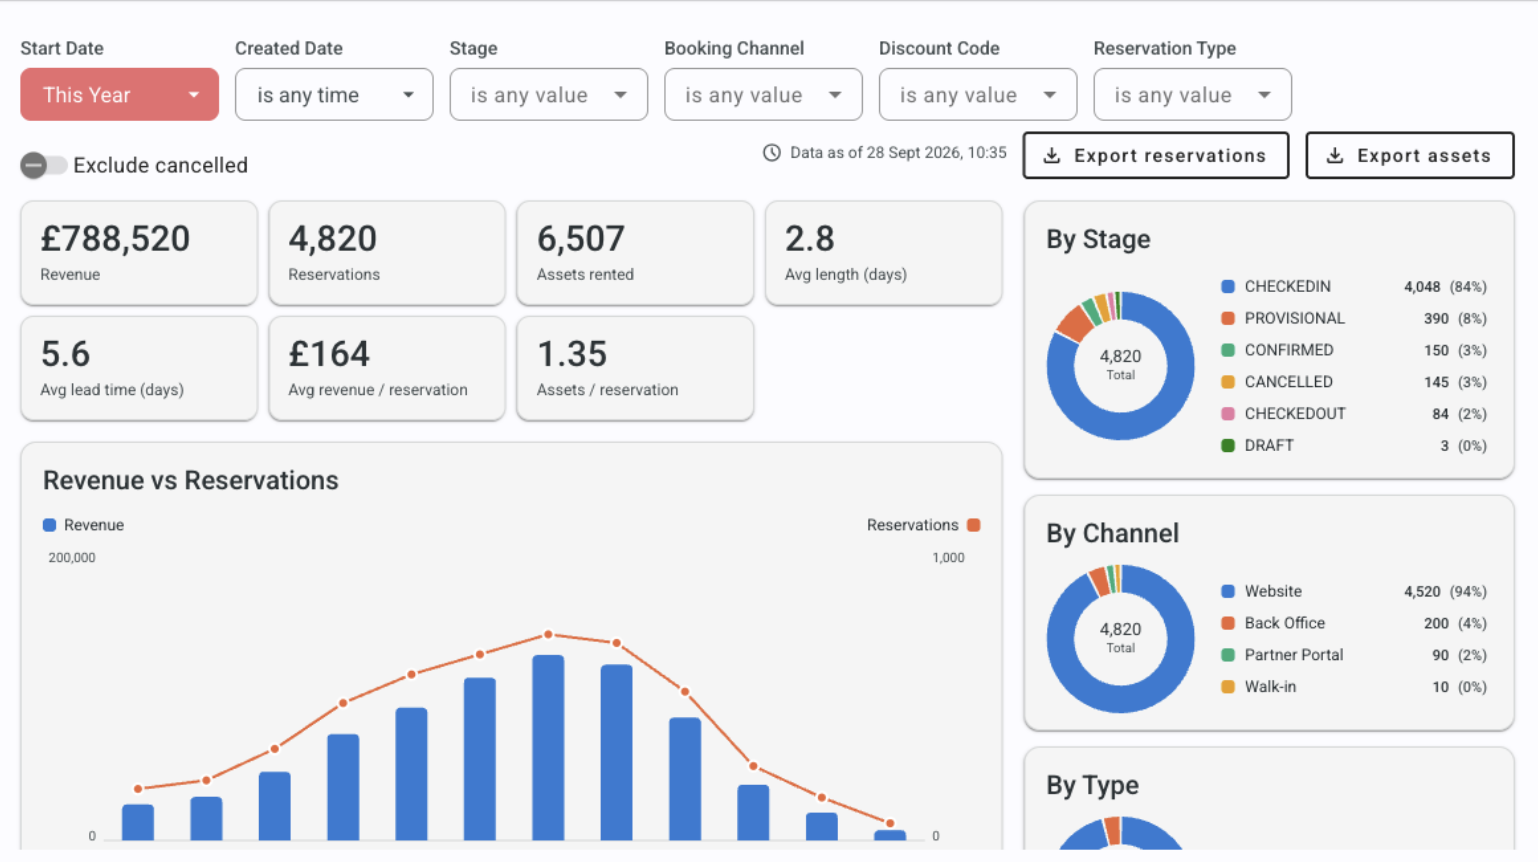
Example: Reports Dashboard default view, showing the filter bar, metric tiles and charts.
Access & Security
A Reports Dashboard card is visible in the Reports section of the back office for users with the Shop manager role.
Clicking the card opens the dashboard directly within the BRM interface.
Report data is restricted to the store you're currently signed in to.
The Reports Dashboard is included with every BRM account and switched on by default. If you can't see it, contact BRM support.
Roles are set per user under Settings → Admin → Users.
Dashboard Overview
This dashboard gives you insights into your reservation activity and revenue performance. Each chart and metric is designed to help you take action and make informed decisions.
Filters
*Every filter takes effect as soon as it's changed.
Filter | Use Case | Options | Default |
Start Date | View bookings starting during a specific date range | Preset & custom | This Year |
Created Date | View when bookings were made (e.g. last-minute vs. planned) | Preset & custom | Any time |
Stage | Filter by reservation stage (e.g. Checked In, Confirmed, Cancelled) | Multi-select | Any value |
Booking Channel | Analyse bookings by source (e.g. website, back office) | Multi-select | Any value |
Discount Code | Assess performance of discount campaigns; searchable | Multi-select | Any value |
Reservation Type | View by internal classification (e.g. client vs. rental) | Multi-select | Any value |
*All filters update every chart on the page. An Exclude cancelled toggle removes cancelled reservations from the revenue and booking totals when switched on.
Dashboard Metrics & Value
Component | What does it do? | Calculation Logic |
Total Revenue | Understand your gross income from all bookings | SUM of totalPrice + delivery + pickup + extras |
Total Reservations | Track your volume of business | COUNT of unique reservations |
Total Assets Rented | See how often your assets are being used | SUM of all assets included in reservations |
Average Length (Days) | Measure how long people are renting for | Total booked days / Total reservations |
Av Lead Time (Days) | Understand how far in advance bookings are made | Average of (Start Date − Created Date) across all reservations |
Av Revenue/Reservation | Assess customer value per transaction | Total Revenue / Total Reservations |
Av Assets/Reservation | Monitor asset usage per booking | Total Assets Rented / Total Reservations |
Charts & Graphs
Chart | What does it do? | Details |
Revenue vs Reservations | Compare volume vs. income month by month | Monthly totals for revenue and reservation count. Click a month to see it broken down by week. |
Reservation Stage | Understand how many bookings progress to each stage | Pie chart showing the percentage of bookings in each stage (Checked In, Confirmed, Cancelled, etc.). Click a slice to filter the whole page to it, and click it again to clear the filter. |
Reservation Type | Track types of customers or booking flows used | Pie chart showing the breakdown of reservation types. Click a slice to filter the whole page to it, and click it again to clear the filter. |
Booking Channel | Evaluate the performance of sales channels | Pie chart showing the percentage of bookings from each channel. Click a slice to filter the whole page to it, and click it again to clear the filter. |
Discount Code | Analyse which discount codes are effective | Pie chart showing the percentage of bookings by discount code. Click a slice to filter the whole page to it, and click it again to clear the filter. |
Asset Revenue | Inventory-level revenue analysis | Pie chart showing the percentage of revenue by asset category. Click a category to drill into its product families, then product lines, then individual assets, with a link back to the level above at any point. Where a level has more than seven values, every value is listed below the chart so nothing is folded away. |
Day of Week | See pickup and return activity by day of the week | Shows pickups and returns broken down by day of the week. |
Additional Functionalities
Feature | What does it do? |
Export Reservations | Downloads reservation-level data for the full selected date range as a CSV file, with no row limit, for your own analysis or reconciliation. While the export is running, the button is disabled and shows "Exporting…" until it completes. |
Export Assets | Downloads asset-level revenue data for the full selected date range as a CSV file, with no row limit, for your own analysis or reconciliation. While the export is running, the button is disabled and shows "Exporting…" until it completes. |
Drilldown | Click into monthly charts to view a more detailed breakdown |
Multi-store Dashboard
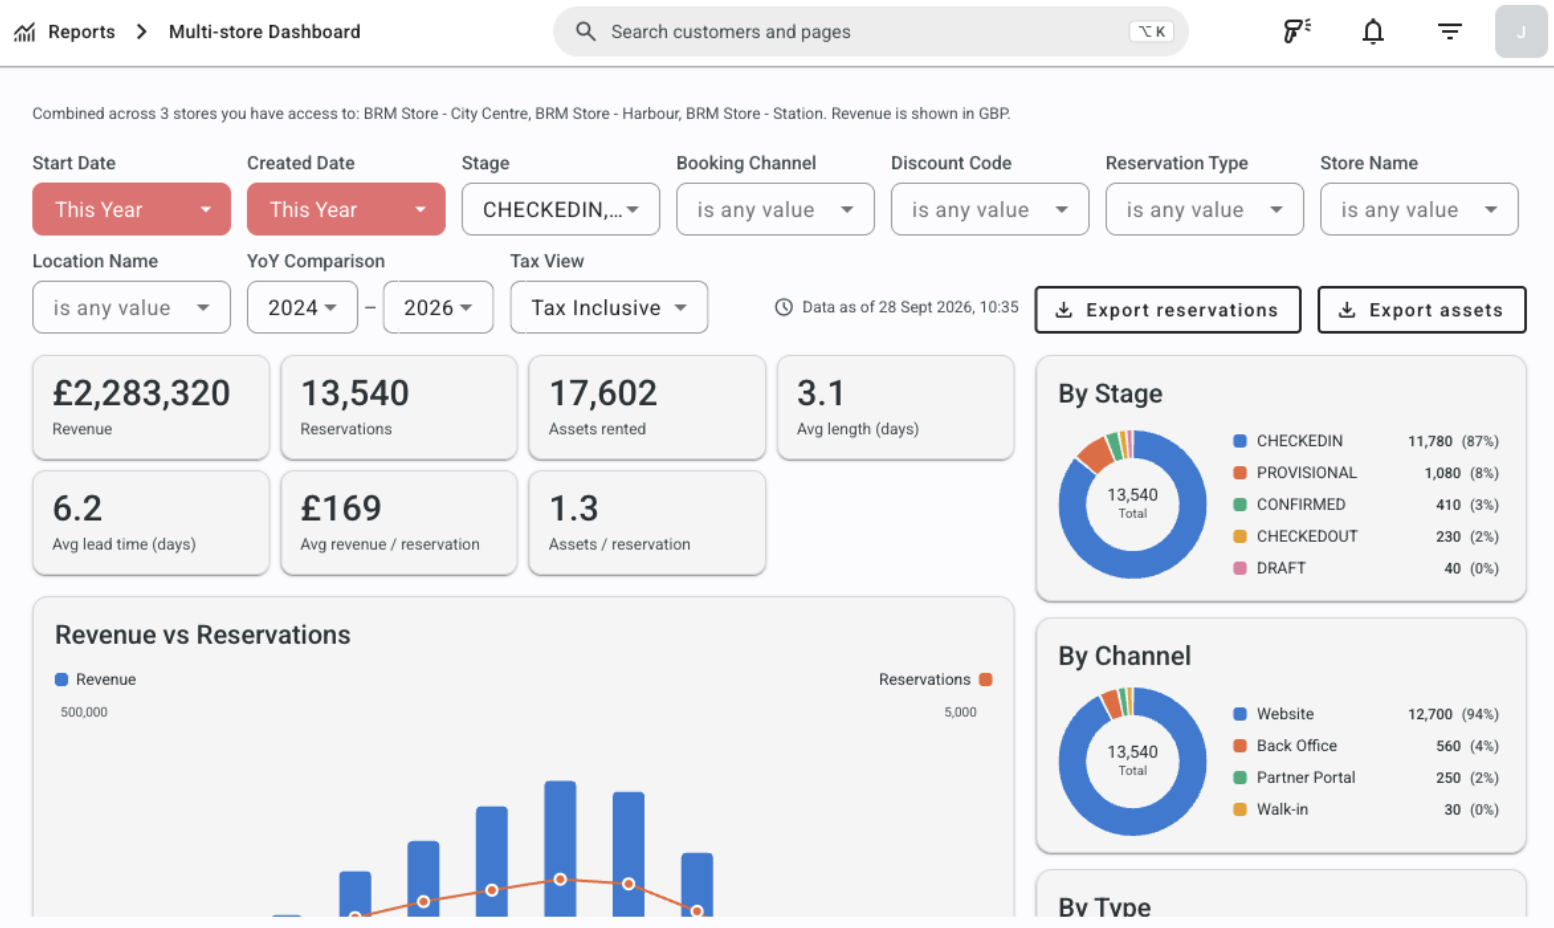
For organisations running more than one store, the Multi-store dashboard combines reservation and revenue figures across every store a staff member has access to, in one view.
Location: Available via the Reports section in the BRM back office, on the Multi-Store Dashboard card.
Who can see it: Shop managers (or Administrators) who have Switch Store enabled on their user account, for the stores in their organisation. It isn't available to users marked as Agent.
Feature | Details |
Store Name / Location Name filters | Narrow the combined view to specific stores or locations. |
Combined-across caption | A line above the charts names the stores the figures are combined across and the currency they're shown in, for example "Combined across 4 stores you have access to: A, B, C, D. Revenue is shown in AED." |
Year-over-year comparison | Compares the current period with the prior period. |
Tax View | Switches figures between inclusive and exclusive of tax. |
Data Validation
All calculation logic is consistent with other BRM reports and tools.
Every filter takes effect immediately, so the dashboard always reflects your current selection.
Common questions & Troubleshooting
The export button won't let me start another export
- While an export is running, its button is disabled and its label changes to "Exporting…" so a second export can't be started from the same button.
How to resolve it:
Wait for the current export to finish — the button re-enables automatically once the file is ready.
If it seems stuck, refresh the page and start the export again.
I can't see the Multi-store Dashboard
The Multi-store Dashboard only appears for users who have Switch Store enabled on their account for stores in their organisation, and it isn't available to users marked as Agent.
How to resolve it:
Check your role and Switch Store setting under Settings → Admin → Users.
The Reports Dashboard is included with every BRM account and switched on by default. If you can't see it, contact BRM support.
A figure looks different from another report
The Reports Dashboard reflects whatever combination of Start Date, Created Date, Stage and Exclude cancelled is currently applied, which may differ from the report you're comparing it to.
How to resolve it
Align the date range, Stage filter and Exclude cancelled toggle with the report you're comparing against.
Was this article helpful?
That’s Great!
Thank you for your feedback
Sorry! We couldn't be helpful
Thank you for your feedback
Feedback sent
We appreciate your effort and will try to fix the article